2022 Sep - Pizza Science - Quantifying pizza cost vs. benefit
Ever since I moved to New West, the concept of getting a fresh pizza in 20 minutes from any of the numerous places was a mouth-watering one. In the spirit of discovering new restaurants, I often wanted to visit smaller pizza shops. However, being weary of my spending, and seeing how the prices varied considerably, I wondered if there was any material difference to justify those price variations. Or perhaps larger chain shops simply leverage economies of scale to produce more for less.
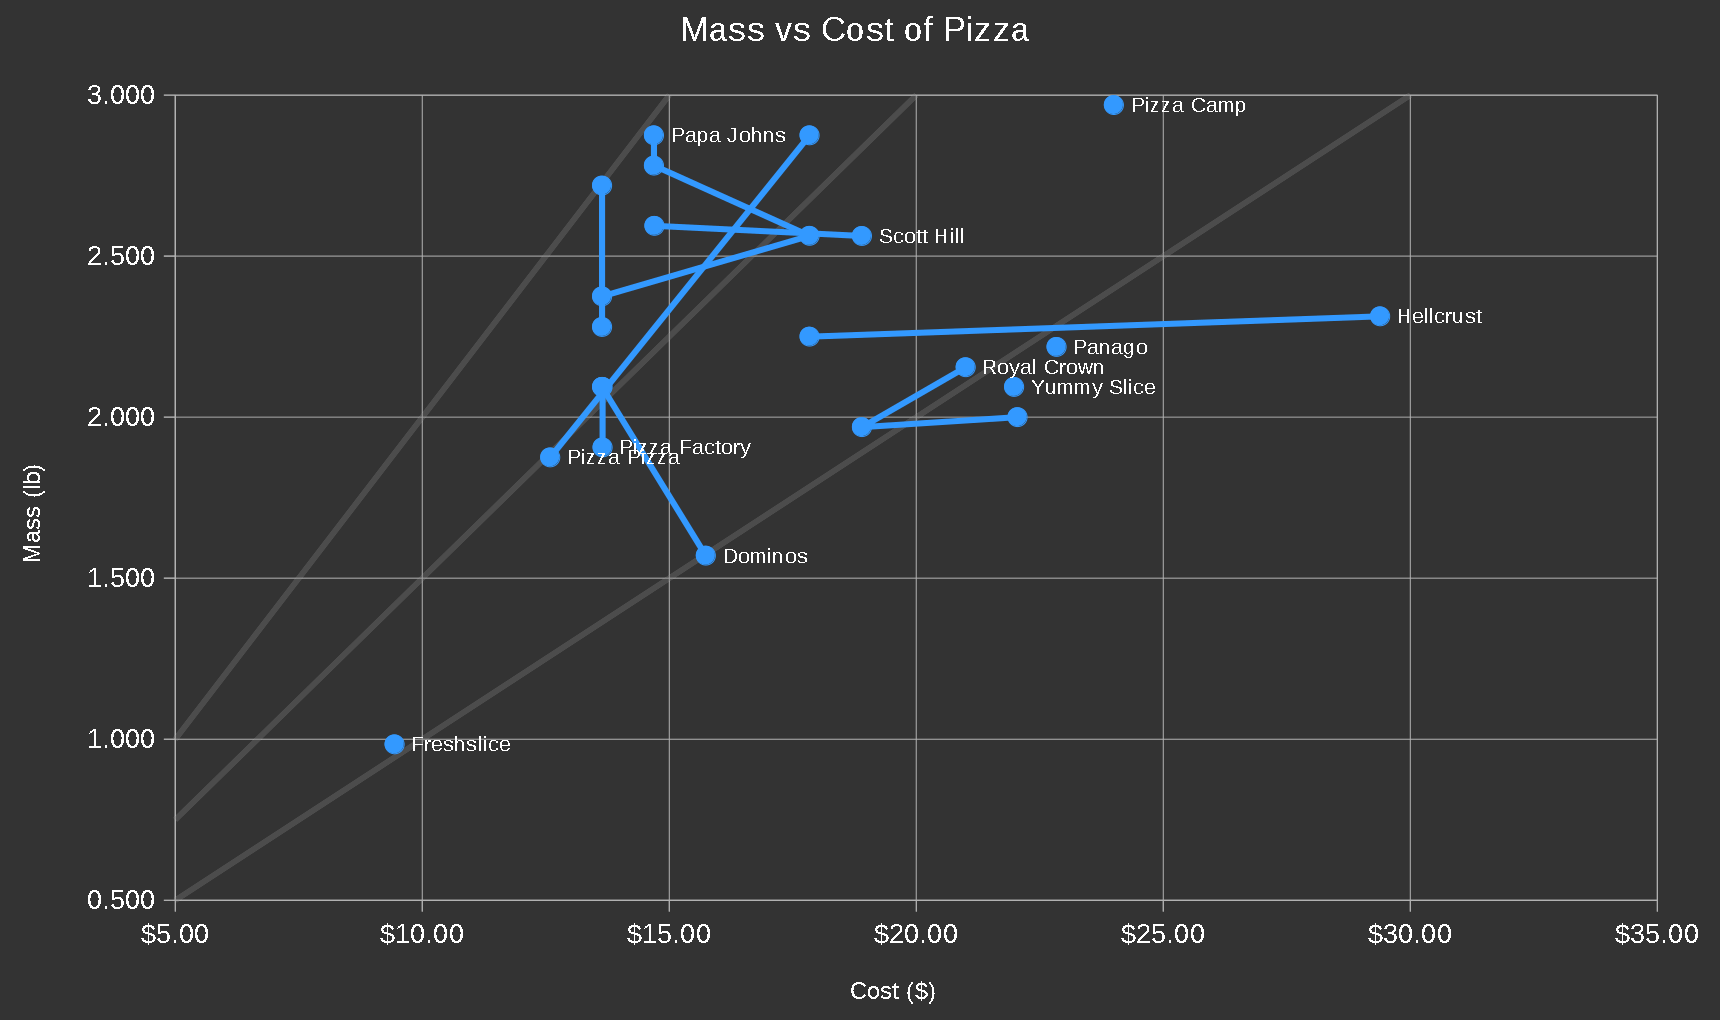
In the chart, the label is on the first datapoint collected, and the trails of points indicate data from chronological samples collected. The diagonal lines show datapoints with equivalent score. The data presented in this plot is from the table below.
The available factors to measure:
- Net Mass of the edible pizza (not the box)
- Cost (after taxes)
- Calories (immediate energy available, how long hunger is prolonged)
- Nutritional value (for supporting long-term health)
- Distance from the retailer to home
We will only be considering Net Mass, Cost, and distance. Distance simply filters for places nearby. We then form a single metric for ranking: mass/$. The data collected for this study has been continually ongoing since the date of this blog post, 2022 Sep. And by no means should one assume that the author has actually eaten all the pizzas represented by these datapoints, that's completely absurd.
It should be noted however, that the distance factor is more of a filter in this case. Currently the datapoints are only collected from retailers within a taxicab distance of 2km of the "home" location. This may grow with the need to collect more data. However, it should be minimized in interest of walking time, delivery time, or tailpipe emissions of the delivery vehicle (how could you enjoy a pizza at the cost of climate change?).
Other notes:
- Rewards earned from a purchase are not taken into account. This may be significant for places that rely on loyalty- Dominos may be an example.
- And why the heck would I measure mass in pounds? Well it's because my kitchen scale happens to be in pounds. The precision is 1/32 lb, or 0.03 lb, or about 2% for the ranges in this study.
| Business | Avg lb/$ | Data Date | $ | Mass (lb) | lb/$ | Type | Size | Diam. | Location |
|---|---|---|---|---|---|---|---|---|---|
| Papa Johns | 0.176 | 2023-02-28 | $14.69 | 2.875 | 0.196 | 2 Topp | Large | ? | View |
| 2023-04-21 | $14.69 | 2.781 | 0.189 | 2 Topp | Large | ? | |||
| 2023-07-07 | $17.84 | 2.563 | 0.144 | ? | ? | ? | |||
| 2023-11-16 | $13.64 | 2.375 | 0.174 | 1 Topp | Large | ? | |||
| 2023-12-19 | $13.64 | 2.719 | 0.199 | 1 Topp | Large | ? | |||
| 2024-01-12 | $13.64 | 2.280 | 0.167 | 1 Topp | Large | ? | |||
| Pizza Pizza | 0.159 | 2023-11-10 | $12.59 | 1.875 | 0.149 | 1 Topp | Large | 14" | View |
| 2023-12-11 | $17.84 | 2.875 | 0.161 | 4 Topp | ExLarge | 16" | |||
| 2026-01-14 | $20.99 | 3.531 | 0.168 | 3 Topp | XXLarge | 17.3" | |||
| Dominos | 0.154 | 2023-04-16 | $15.74 | 1.570 | 0.100 | "VeggieFeast" | Medium | ? | View |
| 2024-03-22 | $13.64 | 2.094 | 0.154 | 2 Topp | Large | 13" | |||
| Scott Hill | 0.151 | 2023-10-01 | $18.90 | 2.563 | 0.136 | "VegSpcl" | Large | ? | View |
| 2024-02-24 | $14.70 | 2.594 | 0.176 | 2 Topp | Large | ? | |||
| 2025-10-26 | $15.75 | 2.219 | 0.141 | ? | Large | ? | |||
| Pizza Factory | 0.147 | 2023-09-05 | $13.65 | 1.906 | 0.140 | 2 Topp | Large | ? | View |
| 2023-10-27 | $13.65 | 2.094 | 0.153 | 2 Topp | Large | 13.5" | |||
| LR Pizza & Curry | 0.139 | 2025-12-07 | $13.96 | 1.938 | 0.139 | 1 Topp | Large | 12.5" | View |
| Hellcrust | 0.126 | 2023-01-27 | $29.39 | 2.313 | 0.079 | "VegVeggSav" | ExLarge | 16" | View |
| 2023-08-18 | $17.84 | 2.250 | 0.126 | 2 Topp | ExLarge | 16" | |||
| Pizza Camp | 0.124 | 2023-10-06 | $24.00 | 2.969 | 0.124 | "Veggie" | ExLarge | 16" | View |
| Pizza Pizzeria | 0.114 | 2025-11-23 | $16.79 | 1.906 | 0.114 | Sun Spcl | Large | 12" | View |
| Pizza Heaven | 0.107 | 2024-08-30 | $20.75 | 2.219 | 0.107 | Veg Special | Large | 13" | View |
| Freshslice | 0.104 | 2023-09-25 | $9.44 | 0.984 | 0.104 | 3Slice+Pop | ? | ? | View |
| Royal Crown | 0.099 | 2023-01-03 | $21.00 | 2.155 | 0.103 | "SuperVegg" | Large | 14" | View |
| 2023-03-15 | $18.90 | 1.969 | 0.104 | 4 Topp | Large | 13.5" | |||
| 2024-01-19 | $22.05 | 2.000 | 0.091 | 4 Topp | Large | 13" | |||
| Panago | 0.097 | 2023-01-30 | $22.84 | 2.218 | 0.097 | "TuscVegg" | Large | ? | View |
| Yummy Slice | 0.095 | 2023-01-22 | $21.98 | 2.094 | 0.095 | 5 Topp + 2 Dip | ExLarge | 16" | View |
| Me-n-Ed's | 0.077 | 2025-08-18 | $24.15 | 1.871 | 0.077 | 1 Topp | Large | ? | View |