Keynote User Guide for iPhone
- Welcome
- What’s new
-
- Get started with Keynote
- Intro to images, charts, and other objects
- Create a presentation
- Choose how to navigate your presentation
- Open a presentation
- Save and name a presentation
- Find a presentation
- Print a presentation
- Copy text and objects between apps
- Basic touchscreen gestures
- Create a presentation using VoiceOver
- Change Keynote privacy and analytics settings
-
- Send a presentation
- Intro to collaboration
- Invite others to collaborate
- Collaborate on a shared presentation
- See the latest activity in a shared presentation
- Change a shared presentation’s settings
- Stop sharing a presentation
- Shared folders and collaboration
- Use Box to collaborate
- Create an animated GIF
- Post your presentation in a blog
- Copyright

Add a border and background to a chart in Keynote on iPhone
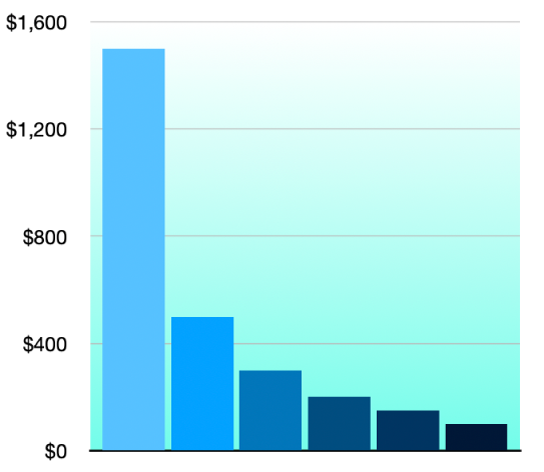
You can add a border and a background color to any 2D bar, column, area, or scatter chart.
Go to the Keynote app
 on your iPhone.
Open a presentation, tap the chart, then tap
 .
.Tap Style, then do any of the following:
Add a background: Tap General, tap Background, then tap Preset, Color, Gradient, or Image and use the controls to adjust the look of the background.
Add a border: Tap Gridlines, then turn on Chart Border.
Note: These options vary depending on the type of chart and data.
Благодарим ви за обратната връзка.