Use the Hue/Saturation Curves filter in Motion
The six curve controls in the Hue/Saturation Curves filter provide maximum precision for color-correcting your images. Not only can you adjust the hue, saturation, and brightness of any color in your project, you can also adjust the saturation for a range of brightness or a range of saturation in a clip, and you can adjust the saturation of a specific color at any point in its range of brightness.
To use the curve controls, apply the Hue/Saturation Curves filter to a layer in your project.
Note: Because you can apply multiple color filters to an image, you’re not required to follow all of the steps below, nor the order of those steps.
Apply the Hue/Saturation Curves filter
In Motion, open the Library, click the Filters category, then click the Color category to reveal the color-correction filters.
Drag the Hue/Saturation Curves filter to the layer in the Layers list you want to adjust.
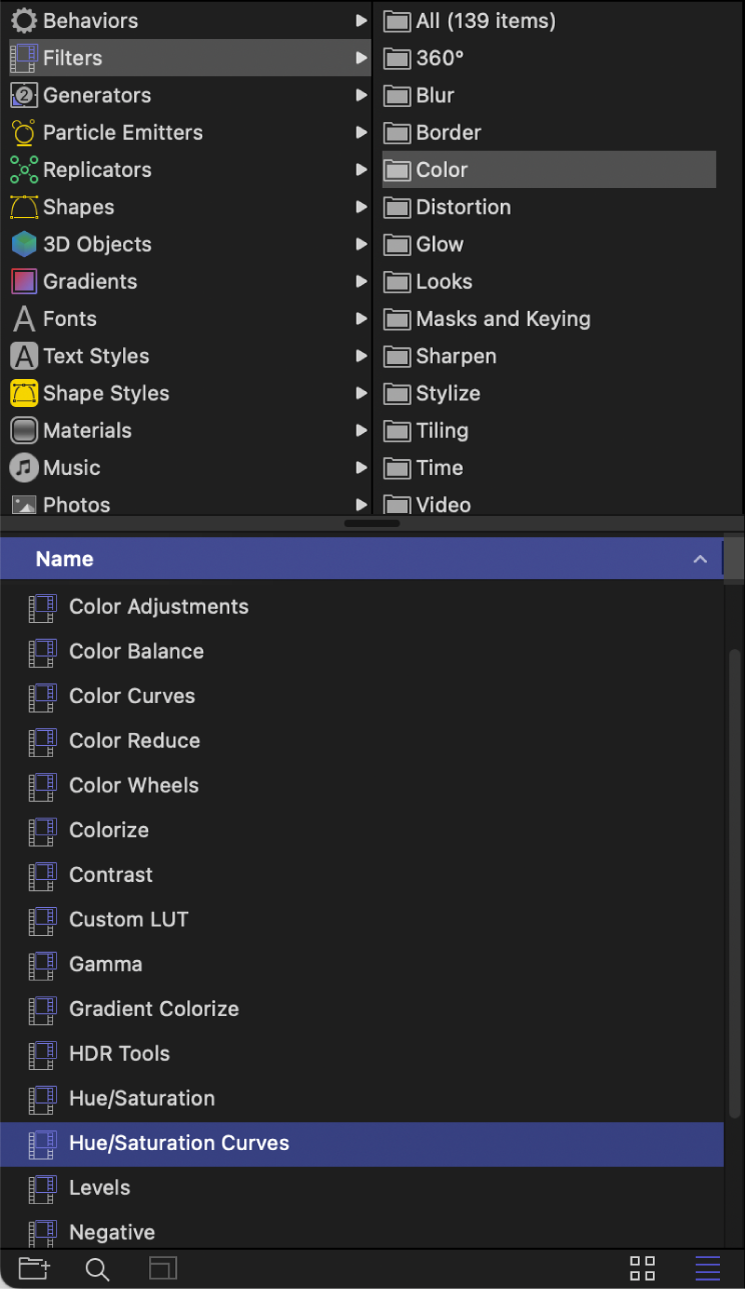
The Hue/Saturation Curves controls appear in the Filters Inspector.
In the Filters Inspector, click the View pop-up menu at the top of the filter controls and choose a display option:
All Curves: Displays all six curves at once.

Single Curves: Displays one large curve at a time. In Single Curves view, click a button above the curve to display a specific curve.
To color-correct the image, follow the instructions below for the adjustment you want to make.
Adjust the hue, saturation, or brightness of a color
In Motion, apply a Hue/Saturation Curves filter, as described in the previous task.
In the Filters Inspector, click the eyedropper for the curve that you want to use:
Hue vs Hue: Changes the color (hue) of any range of hues in the image.
Hue vs Sat: Changes the saturation of any hue in the image.
Hue vs Luma: Changes the brightness of any hue in the image.
In the canvas, click or drag over the color in the image that you want to adjust.
Dragging increases the range of color selected.

Three control points appear on the curve in the Filters Inspector. The control point with the vertical line represents the color you selected with the eyedropper. Two additional control points represent a buffer range of adjacent hues that were also selected (to ensure a more natural gradient of selected color). In the following image, the orange control point represents the color selected with the eyedropper, and the green and magenta control points represent adjacent hues on the color spectrum.

In the above image, notice that red hues appear on the left side of the graph and on the right side of the graph. This is because the hue curve wraps around the graph, representing the spectrum of colors.
Note: You can also create control points by clicking the curve, but the eyedropper method is generally more precise. To delete a control point, select the point, then press the Delete key.
Drag the control point with the vertical line to modify the selected color range.
Each curve modifies a selected color in a different way:
Hue vs Hue: Dragging the control point up or down moves the selection through the hues of the spectrum.
When the orange control point is moved, the curve adjusts on both sides of the graph. This is because the buffer range of hues adjacent to the orange control point wrap around the curve. (When viewed on a color wheel, orange and red hues appear between the green and magenta hues.) In this case, hue adjustment is limited to the values between control points on either side of the orange control point. Hues in the center of the graph—the range between the green and magenta control points—are not affected.

The image updates in the canvas, showing the new color selection.

Note: If you use the Hue vs Hue curve to change the hue and then use the eyedropper in any other curve in the same instance of the Hue/Saturation Curves filter, the eyedropper selects the original hue—not the altered hue. To select the altered hue, adjust the control points without using the eyedropper, or add a second instance of the Hue/Saturation Curves filter.
Hue vs Sat: Dragging the control point up increases the selected color’s saturation, and dragging the control point down decreases the saturation.

Hue vs. Luma: Dragging the control point up increases the selected color’s brightness, and dragging the control point down decreases the brightness.
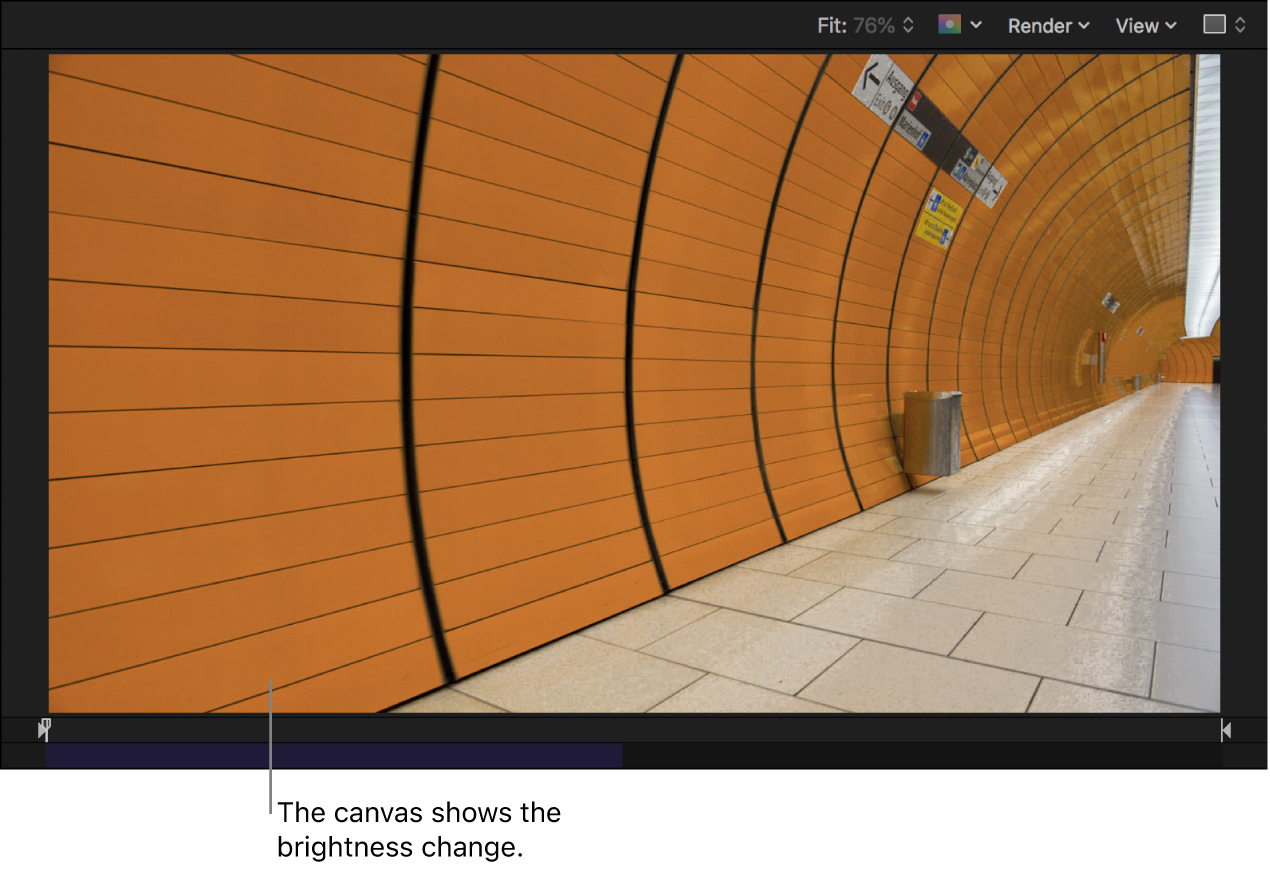
Note: To make fine adjustments, press and hold the Option key as you drag a control point. To constrain the control point to vertical or horizontal movement only, press and hold the Shift key as you drag.
To broaden the selected color range, drag the two outer control points to the left or the right, or just delete them.
To reset the values for a color curve, click its Reset button (the curved arrow). To reset the values for all curves, click the down arrow in the upper-right corner of the filter controls to open the Animation pop-up menu, then choose Reset Parameter.

Adjust the saturation for a range of brightness
You can use the Luma vs Sat curve to create special looks and to make a clip broadcast-safe by reducing oversaturation.
In Motion, apply a Hue/Saturation Curves filter, as described above.
In the Filters Inspector, click the eyedropper for the Luma vs Sat curve.
If all six curves are shown in the Inspector, you may need to scroll to see the Luma vs. Sat curve. In Single Curves view, click the LvS button at the top to display the curve.
In the canvas, click or drag over the color in your image whose saturation you want to adjust.

Control points (in addition to the two start and end control points) appear on the curve in the Filters Inspector. The control point with the vertical line represents the level of luma (brightness) for the color you selected with the eyedropper. The control points on either side of the control point with the vertical line represent a buffer range of adjacent brightness values (to ensure a more natural gradient of selected brightness).

Note: You can also create control points by clicking the curve, but the eyedropper method is generally more precise. To delete a control point, select the point, then press the Delete key.
Drag the control point with the vertical line up to increase color saturation in the selected range of brightness, or down to decrease the color saturation.
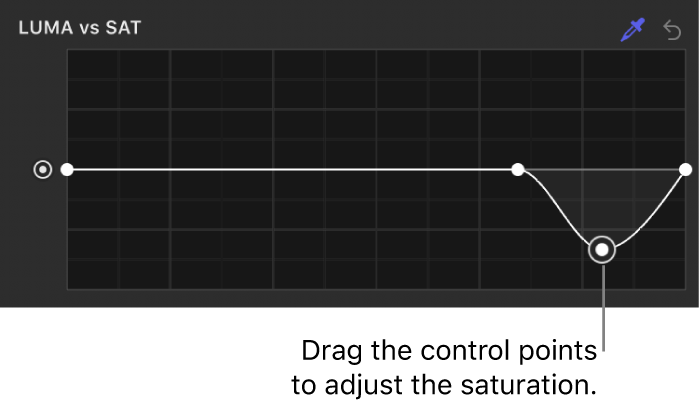
Note: To make fine adjustments, press and hold the Option key as you drag a control point. To constrain the control point to vertical or horizontal movement only, press and hold the Shift key as you drag.
The luma change is updated in the canvas.

To adjust the range of luma values selected, drag the two outer control points to the left or the right, or just delete them.
To adjust the saturation for a different range of brightness, click the curve to add control points, then adjust them as needed.
Add and adjust control points on the left end of the curve to adjust shadows; add and adjust control points in the middle of the curve to adjust midtones; or add and adjust control points on the right end of the curve to adjust highlights. Drag any control point up or down to increase or decrease saturation for that region of brightness.
Adjust the saturation within a range of saturation
The Sat vs Sat curve allows you to create special looks by selecting and adjusting a range of saturation within the image’s original saturation. You can increase the saturation of areas with low saturation, or you can desaturate oversaturated areas to make them safe for broadcast. In the example below, the saturation is increased in a region of low saturation in the original image.
In Motion, apply a Hue/Saturation Curves filter, as described above.
In the Filters Inspector, click the eyedropper for the Sat vs Sat curve.
If all six curves are shown in the Inspector, you may need to scroll to see the Sat vs. Sat curve. In Single Curves view, click the SvS button at the top to display the curve.
In the canvas, click or drag over the color in your clip whose saturation you want to adjust.
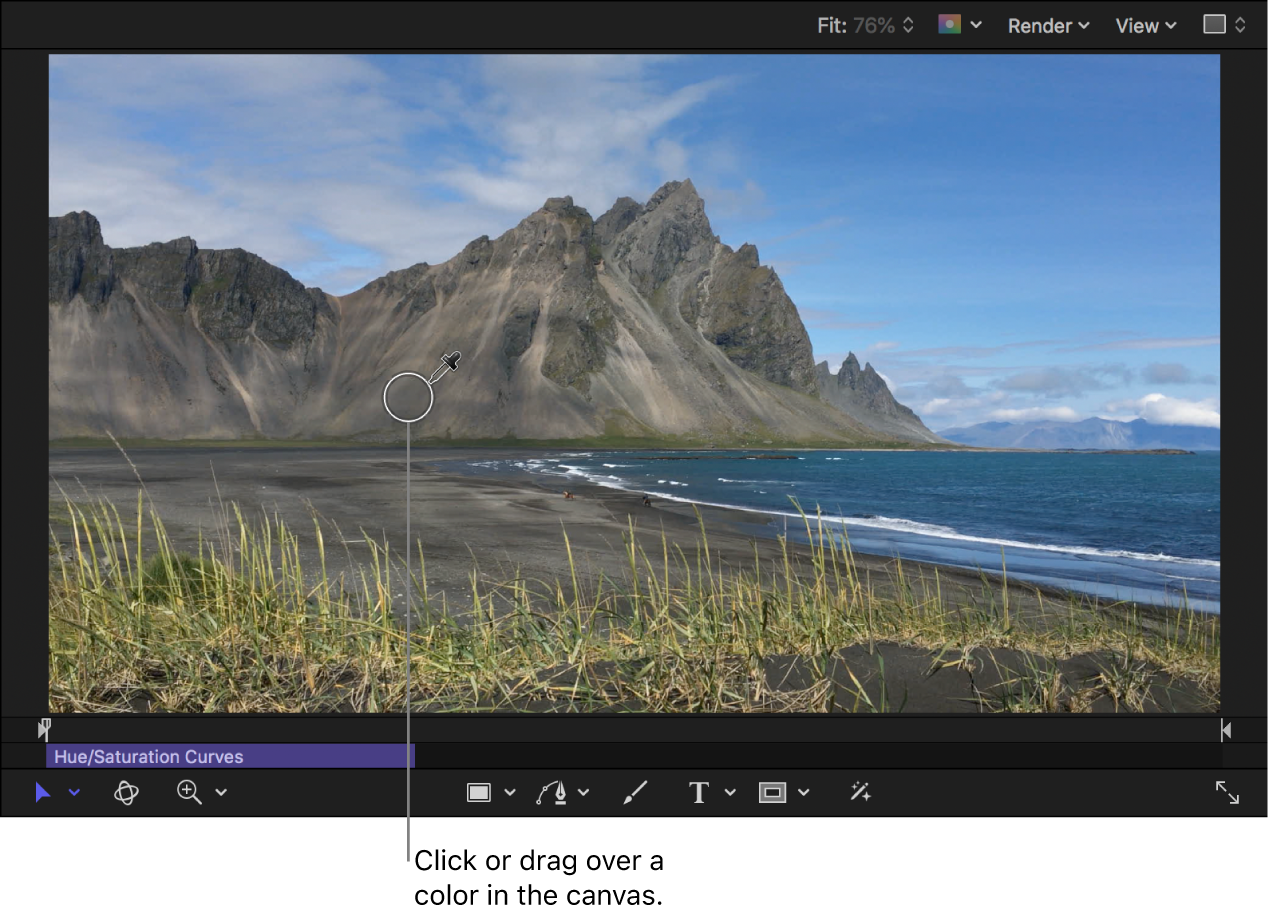
Control points (in addition to the two start and end control points) appear on the curve in the Filters Inspector. The control point with the vertical line represents the level of saturation you selected with the eyedropper. Two additional control points on either side of the middle point represent a buffer range of adjacent saturation values that were also selected (to ensure a more natural gradient of selected saturation values).

Note: You can also create control points by clicking the curve, but the eyedropper method is generally more precise. To delete a control point, select the point, then press the Delete key.
Drag the control point with the vertical line up to increase the color saturation in the selected saturation range, or down to decrease the saturation.
Note: To make fine adjustments, press and hold the Option key as you drag a control point. To constrain the control point to vertical or horizontal movement only, press and hold the Shift key as you drag.
The saturation change is updated in the canvas.

To change the range of saturation selected, drag the two outer control points to the left or the right, or just delete them.
To adjust the saturation for a different range of saturation, click the curve to add control points, and adjust them as needed.
Add and adjust control points on the left end of the curve to adjust regions of low saturation; add and adjust control points in the middle of the curve to adjust regions of medium saturation; or add and adjust control points on the right end of the curve to adjust highly saturated regions. Drag any control point up or down to increase or decrease saturation for that region of saturation.
Adjust the saturation of a specific color at any point along its range of brightness
You can use the Orange vs Sat curve to adjust a specific color’s saturation at any point along its range of tonality from darkest to brightest.
Note: The default color for the curve is orange (because it aligns with skin tone), but you can select any color and adjust its saturation.
In Motion, apply a Hue/Saturation Curves filter, as described above.
In the Filters Inspector, click the eyedropper for the Orange vs Sat curve.
If all six curves are shown in the Inspector, you may need to scroll to see the Orange vs. Sat curve. In Single Curves view, click the Orange button at the top to display the curve.
In the canvas, click or drag over the color in your clip whose saturation you want to adjust.

The curve color changes to the color you selected in the viewer. The name of the curve also changes to reflect the selection—for example, to “Cyan vs Sat.”

You can also change the color of a curve by clicking its name (in the top-left corner of the curve) and then clicking or dragging in the color wheel to select a color.

Click the curve to add control points, then drag them up or down to increase or decrease the saturation of the selected color.
To delete a control point, select the point, then press the Delete key.

To make fine adjustments, press and hold the Option key as you drag a control.
Add and adjust control points on the left end of the curve to adjust shadows; add and adjust control points in the middle of the curve to adjust midtones; or add and adjust control points on the right end of the curve to adjust highlights.
Offset an entire curve by the same amount
In Motion, apply and adjust a Hue/Saturation Curves filter, as described above.
In the Filters Inspector, drag the control on the left side of any of the six curve controls up or down.
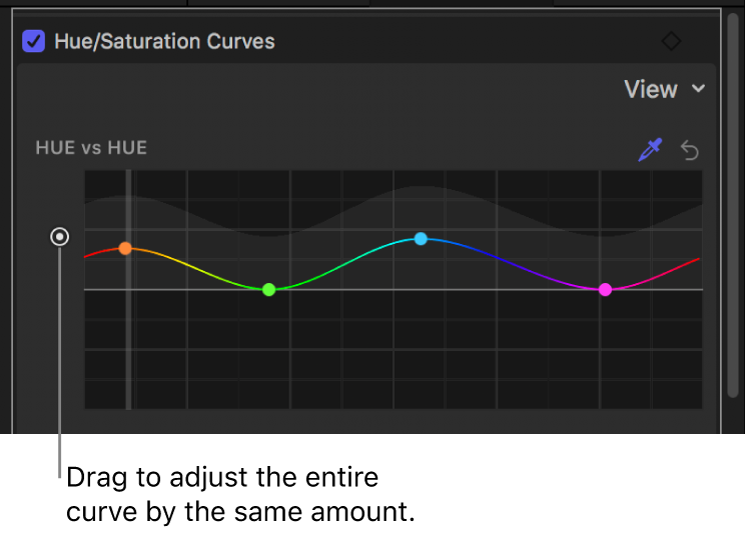
The entire curve is uniformly adjusted.
Animate color changes over time with keyframes
You can animate color changes over time using keyframe recording.

Note: You can also animate color changes using behaviors.
In Motion, apply a Hue/Saturation Curves filter, as described above.
Navigate to the frame you want to color animation to begin.
In the Filters Inspector, do one of the following:
Position the pointer in the upper-right corner of the filter, then click the Add Keyframe button (a plus sign in a gray diamond).
Position the pointer in the upper-right corner of the filter, click the down arrow to open the Animation pop-up menu, then choose Add.

Control-click the filter name, then choose Add from the shortcut menu.
A keyframe is added at the current playhead position.
In the Filters Inspector, click the eyedropper for the Hue vs Hue curve, then click or drag over the color in the image in the canvas that you want to adjust.
When you release the mouse button, control points appear on the curve in the Filters Inspector. The control point with the vertical line represents the color you selected with the eyedropper.

In the Filters Inspector, drag the color’s control point to change the hue of the selected color.
Move the playhead to the next frame where you want a keyframe.
Repeat steps 5–6 until you finish.
You can also simultaneously animate all parameters of the Hue/Saturation Curves filter. For more information about animating filters, see Animate filter parameters with keyframes or Animate filters using behaviors.
Note: You can’t publish the Hue/Saturation Curves filter as a Final Cut Pro custom effects template.
Download this guide: PDF