Logic Pro User Guide
- Welcome
-
- What is Logic Pro?
- Logic Pro project basics
- Use the complete set of Logic Pro features
- Undo and redo edits
- Manage Logic Pro content
- How to get help
-
- Projects overview
- Create projects
- Open projects
- Save projects
- Delete projects
-
- Play a project
- Set the playhead position
- Control playback with the transport buttons
- Use transport shortcut menus
- Use transport key commands
- Customize the control bar
- Change the LCD display mode in Logic Pro
- Monitor and reset MIDI events
- Use the cycle area
- Use the Chase Events function
- Use Apple Remote to control Logic Pro
- Use Logic Remote to control Logic Pro projects
- Preview projects in the Finder
- Close projects
- View project information
-
- Overview
-
- Before recording software instruments
- Play software instruments
- Record software instruments
- Record additional software instrument takes
- Overdub software instrument recordings
- Spot erase software instrument recordings
- Use Note Repeat
- Record to multiple software instrument tracks
- Replace software instrument recordings
- Record multiple MIDI devices to multiple tracks
- Record software instruments and audio simultaneously
- Use step input recording techniques
- Use the metronome
-
- Arranging overview
-
- Regions overview
- Select regions
- Select parts of regions
- Cut, copy, and paste regions
- Move regions
- Add or remove gaps
- Delay region playback
- Loop regions
- Repeat regions
- Resize regions
- Mute and solo regions
- Time stretch regions
- Reverse audio regions
- Split regions
- Demix MIDI regions
- Join regions
- Create regions in the Tracks area
- Normalize audio regions in the Tracks area
- Create aliases of MIDI regions
- Convert repeated MIDI regions to loops
- Change the color of regions
- Convert audio regions to samples for a sampler instrument
- Rename regions
- Delete regions
- Create groove templates
-
- Overview
-
- Add notes
- Select notes
- Snap items to the grid
- Move notes
- Copy notes
- Change the pitch of notes
- Resize notes
- Edit note velocity
- Quantize the timing of notes
- Quantize the pitch of notes
- Change note articulations
- Lock the position of events
- Mute notes
- Change note color
- View note labels
- Delete notes
- Time stretch notes
- View multiple MIDI regions
- Split chords
- Automation/MIDI area in the Piano Roll Editor
- Open other editors
-
- Logic Pro advanced editors overview
-
- Audio File Editor overview
- Play audio files in the Audio File Editor
- Navigate audio files in the Audio File Editor
-
- Audio File Editor edit commands
- Edit audio files with transient markers
- Use the Audio File Editor Pencil tool
- Trim or silence audio files
- Remove DC offset
- Set audio file levels
- Normalize audio files
- Fade audio files
- Reverse audio and invert phase
- Audio File Editor Loop commands
- Undo Audio File Editor edits
- Backup audio files
- Use an external sample editor
-
- Mixing overview
- Set channel strip input formats
- Set channel strip pan or balance positions
- Mute and solo channel strips
-
- Plug-ins overview
- Add, remove, move, and copy plug-ins
- Insert a plug-in on a track using drag and drop
- Activate plug-ins on inactive channels
- Use the Channel EQ
- Work in the plug-in window
- Work with plug-in settings
- Work with plug-in latencies
- Work with Audio Units plug-ins in Logic Pro
- Support for ARA 2 compatible plug-ins
- Use MPE with software instruments
- Use the Plug-in Manager
- Work with channel strip settings
- Surround panning
- Use the I/O Labels window
- Undo and redo Mixer and plug-in adjustments
-
- Smart Controls overview
- Show Smart Controls for master effects
- Choose a Smart Control layout
- Automatic MIDI controller assignment
- Map screen controls automatically
- Map screen controls
- Edit mapping parameters
- Use parameter mapping graphs
- Open the plug-in window for a screen control
- Rename a screen control
- Use articulation IDs to change articulations
- Assign hardware controls to screen controls
- Compare Smart Control edits with saved settings
- Use the Arpeggiator
- Automate screen control movements
-
- Live Loops overview
- Start and stop cells
- Work with Live Loops cells
- Change loop settings for cells
- How the Live Loops grid and Tracks area interact
- Edit cells
- Edit scenes
- Work in the Cell Editor
- Bounce cells
- Record a Live Loops performance
- Change Live Loops grid settings
- Control Live Loops with other devices
-
- Overview
- Add notes
-
- Part box overview
- View score symbols
- Select score symbols
- Add notes and rests
- Add notes and symbols to multiple regions
- Add key and time signature changes
- Change the clef sign
- Add dynamic marks, slurs, and crescendi
- Change note heads
- Add symbols to notes
- Add trills, ornaments, and tremolo symbols
- Add sustain pedal markings
- Add chord symbols
- Add chord grids and tablature symbols
- Add bar lines, repeats, and coda signs
- Add page and line break symbols
-
- Select notes
- Move and copy notes
- Change note pitch, duration, and velocity
- Change note articulations
- Quantize the timing of notes
- Restrict note input to the current key
- Control how ties are displayed
- Add and edit tuplets
- Override display quantization using tuplets
- Add grace notes and independent notes
- Delete notes
- Use automation in the Score Editor
-
- Staff styles overview
- Assign staff styles to tracks
- Staff Style window
- Create and duplicate staff styles
- Edit staff styles
- Edit staff, voice, and assign parameters
- Add and delete staffs or voices in the Staff Style window in Logic Pro
- Copy staffs or voices in the Staff Style window in Logic Pro
- Copy staff styles between projects
- Delete staff styles
- Assign notes to voices and staffs
- Display polyphonic parts on separate staffs
- Change the staff assignment of score symbols
- Beam notes across staffs
- Use mapped staff styles for drum notation
- Predefined staff styles
- Share a score
-
-
- Key commands overview
- Browse, import, and save key commands
- Assign key commands
- Copy and print key commands
-
- Global Commands key commands
- Global Control Surfaces Commands
- Various windows
- Windows Showing Audio files
- Main Window Tracks and Various Editors
- Live Loops Grid key commands
- Various Editors
- Views showing Time Ruler
- Main Window Tracks
- Mixer
- MIDI Environment
- Piano Roll
- Score Editor
- Event Editor
- Step Editor
- Step Sequencer key commands
- Project Audio
- Audio File Editor
- Smart Tempo Editor
- Sampler
- Step Input Keyboard
- Tools
-
- Various windows modifier keys and actions
- Controller Assignments window modifier keys and actions
- Tracks area modifiers and actions
- Global tracks modifier keys and actions
- Automation modifier keys and actions
- Live Loops Grid modifier keys and actions
- Mixer modifier keys and actions
- MIDI Environment window modifier keys and actions
- Piano Roll Editor modifier keys and actions
- Score Editor modifier keys and actions
- Event List modifier keys and actions
- Step Editor modifier keys and actions
- Step Sequencer modifier keys and actions
- Flex Time modifier keys and actions
- Touch Bar shortcuts
-
-
- Working with your control surface
- Connect control surfaces
- Add a control surface to Logic Pro
- Automatic assignment for USB MIDI controllers
- Grouping control surfaces
- Control Surfaces preferences overview
- Modal dialog display
- Tips for using your control surface
- Supported control surfaces
- Software and firmware for Logic Pro
-
-
- Environment overview
- Common object parameters
- Customize the Environment
-
-
- Fader objects overview
- Use fader objects
- Play back fader movements
- Work with object groups
- Fader styles
- Fader functions: MIDI events
- Fader functions: range, value as
- Fader functions: filter
- Vector fader
- Special faders overview
- Cable switchers
- Meta event faders
- SysEx faders
- Work with SysEx messages
- Special functions
- Ornament objects
- MMC record buttons
- Keyboard objects
- Monitor objects
- Channel splitter object
- Physical input objects
- Physical input objects
- MIDI click objects
-
- Effects overview
-
- Use MIDI plug-ins
-
- Arpeggiator overview
- Arpeggiator control parameters
- Note order parameters overview
- Note order variations
- Note order inversions
- Arpeggiator pattern parameters overview
- Use Live mode
- Use Grid mode
- Arpeggiator options parameters
- Arpeggiator keyboard parameters
- Use keyboard parameters
- Assign controllers
- Modifier controls
- Note Repeater controls
- Randomizer controls
-
- Use the Scripter
- Use the Script Editor
- Scripter API overview
- MIDI processing functions overview
- HandleMIDI function
- ProcessMIDI function
- GetParameter function
- SetParameter function
- ParameterChanged function
- Reset function
- JavaScript objects overview
- Use the JavaScript Event object
- Use the JavaScript TimingInfo object
- Use the Trace object
- Use the MIDI event beatPos property
- Use the JavaScript MIDI object
- Create Scripter controls
- Transposer MIDI plug-in controls
-
- Instruments introduction
-
- Alchemy overview
- Alchemy interface overview
- Alchemy Name bar
- Alchemy file locations
-
- Alchemy source overview
- Source master controls
- Import browser
- Source subpage controls
- Source filter controls
- Source filter use tips
- Source elements overview
- Additive element controls
- Additive element effects
- Spectral element controls
- Spectral element effects
- Pitch correction controls
- Formant filter controls
- Granular element controls
- Sampler element controls
- VA element controls
- Source modulations
- Morph controls
- Alchemy master voice section
- Alchemy Extended parameters
-
- Sculpture overview
- Sculpture interface
- Global parameters
- Amplitude envelope parameters
- Use the Waveshaper
- Filter parameters
- Output parameters
- Use surround range and diversity
- Define MIDI controllers
- Extended parameters
-
-
- Ultrabeat overview
- Ultrabeat interface
- Synthesizer section overview
- Filter section controls
- Distortion circuit controls
- Glossary
- Copyright

Use parameter mapping graphs in Logic Pro
 When Enable Complete Features is selected in Logic Pro > Preferences > Advanced, you can edit the Parameter graph for each parameter mapping to remap (or scale) input values from the screen control to different output values. The graph includes a series of preset curves that you can apply. The graph for one mapped parameter can be copied and pasted to another mapped parameter. You can also invert the range of values or reset the graph.
Open the Parameter graph
In Logic Pro, in the Parameter Mapping area of the Smart Control inspector, click the Scaling: Open button.
The Parameter graph window opens. The title of the graph window shows the parameter name.
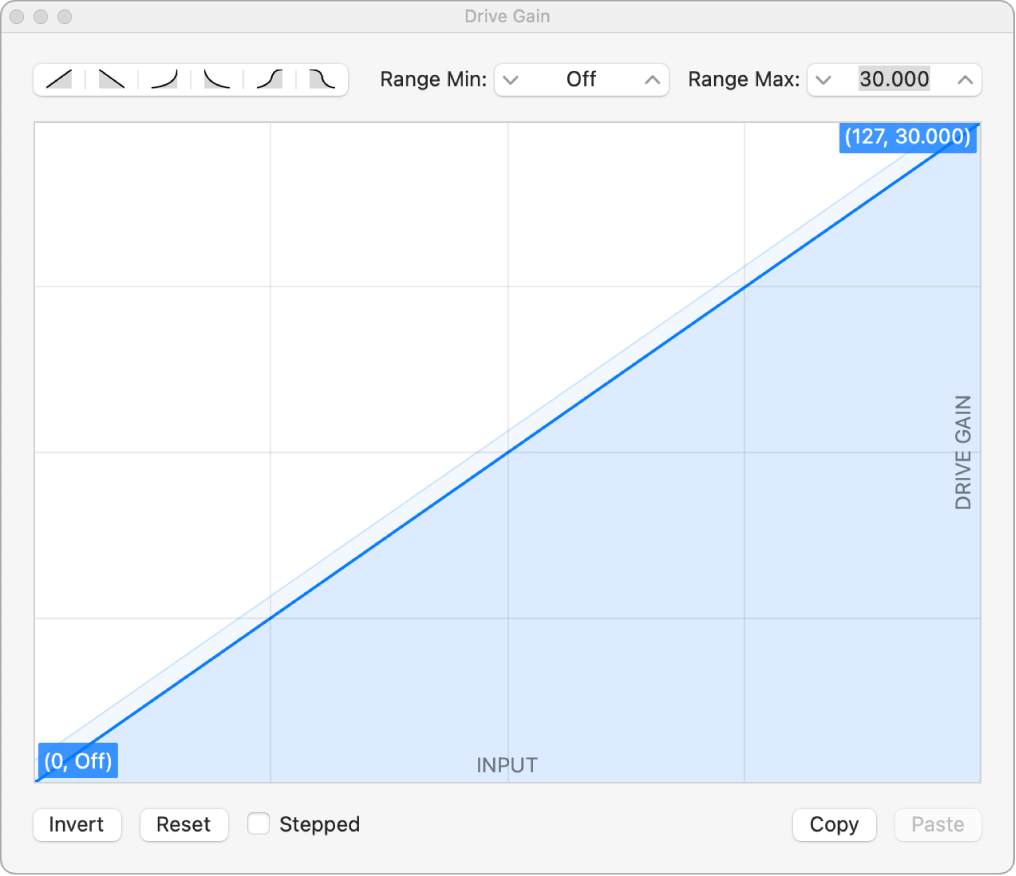
The graph shows the range of input values on the horizontal (x) axis, moving from left to right, and the range of output values on the vertical (y) axis, moving from bottom to top.
In the graph window, you have several ways of working: you can edit the graph curve directly, set the graph to use one of the predefined curves, or change the minimum and maximum range values for the graph.
Edit the graph
In Logic Pro, do any of the following:
Click a curve button (in the upper-left part of the window) to use one of the preset curves.
Click the curve at the location where you want to add a curve point, then drag the curve point to the desired value. Drag horizontally to change the input value or vertically to change the output value.
As you drag, the current values of the curve point appear next to the pointer.
Double-click the curve at the location where you want to add a curve point, then edit the values for the curve point.
Option-click any part of the curve (except a curve point), then drag the dotted part of the curve to make the curve nonlinear.
Click Invert to invert the values of the curve.
Click Reset to reset the graph to its original (default) values.
Continue adding and adjusting points until you’re happy with the result.
When you’re finished, click the close button at the upper-left corner of the graph window.
Copy the graph
In Logic Pro, click the Copy button on the right side of the graph window.
Paste a copied graph
In Logic Pro, click the Paste button on the right side of the graph window.
Download the guides:
Logic Pro User Guide: Apple Books | PDF
Logic Pro Instruments: Apple Books | PDF
Logic Pro Effects: Apple Books | PDF