2.x: Contour level count is not respected #6782
Description
This example could probably be trimmed a bit, but it will suffice:
import numpy as np
import matplotlib.pyplot as plt
# produces a polygon with multiple holes:
nx, ny = 10, 10
numlev = 2
lons, lats = np.meshgrid(np.linspace(-50, 50, nx),
np.linspace(-45, 45, ny))
data = np.sin(np.sqrt(lons ** 2 + lats ** 2))
plt.subplot(221)
plt.contourf(lons, lats, data, numlev)
plt.subplot(222)
plt.contourf(lons, lats, data, numlev, )
numlev = 2
x, y = np.meshgrid(np.arange(-5.5, 5.5, 0.25), np.arange(-5.5, 5.5, 0.25))
dim = x.shape[0]
data = np.sin(np.sqrt(x ** 2 + y ** 2))
lats = np.arange(dim) + 30
lons = np.arange(dim) - 20
plt.subplot(223)
plt.contourf(lons, lats, data, numlev)
plt.subplot(224)
plt.contourf(lons, lats, data, numlev)
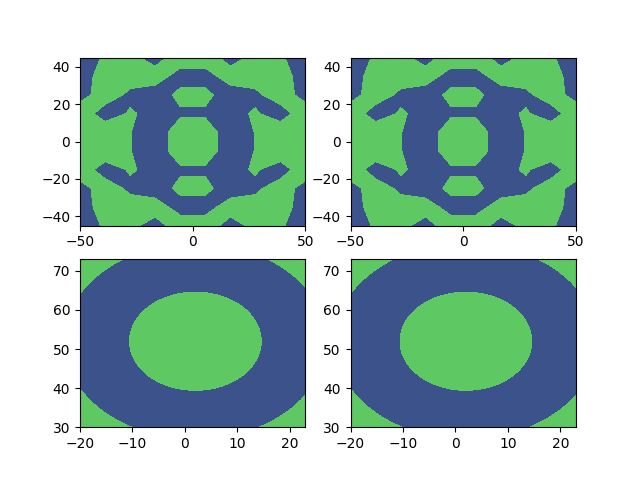
plt.show()Running with v2.0.0b1, it produces two colours/regions:
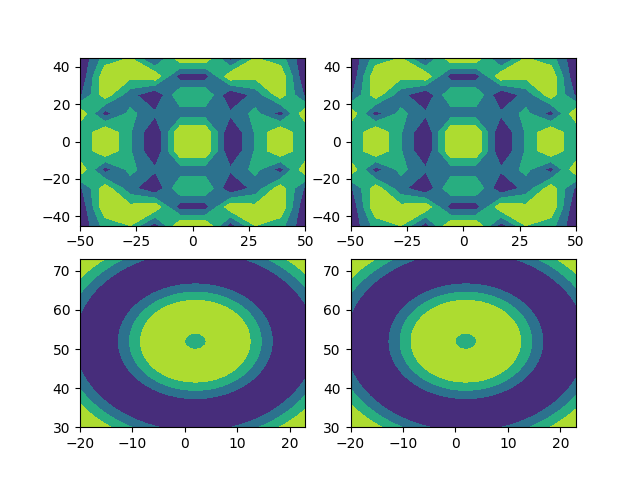
Running with v2.0.0b3, it produces 4 colours/regions:
Bisect points to f810e0d:
Author: Eric Firing <efiring@hawaii.edu>
Date:   Tue Jun 14 12:03:04 2016 -1000

    FIX: try to ensure 2 ticks with AutoLocator.

    replaces #6578
    closes #5784