Open
Description
Bug summary
When using Axes.imshow(), images are scaled to integer pixel size (_ImageBase._make_image). This makes images notably too large when using vector graphics output, misaligning them with tick marks and plotted lines.
Code for reproduction
import numpy as np
import matplotlib as mpl
import matplotlib.pyplot as plt

img = np.zeros((100, 400))
img[::5, ::5] = 1
idx = np.indices(img.shape)
idx = [idx[0][::5].flatten(), idx[1][:, ::5].flatten()]

fig, ax = plt.subplots(constrained_layout=True)
ax.imshow(img, interpolation="None", origin="lower")
ax.scatter(idx[1], idx[0], marker="x", lw=0.2, s=1)
fig.savefig("imshow.pdf")
Actual outcome
The image does not align with plot markers, tick marks. Towards the top-right corner, they are even placed in adjacent pixels.
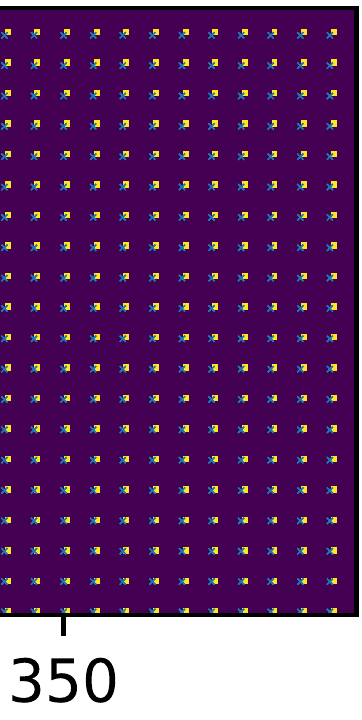
Full PDF output
Expected outcome
This can be worked around by calling _ImageBase._make_image with round_to_pixel_border=False:
class NotRoundedAxesImage(mpl.image.AxesImage):
    """AxesImage subclass which does not round image extents to fit frame

    This rounding leads to improper alignment between data and image
    """
    def make_image(self, renderer, magnification=1.0, unsampled=False):
        # docstring inherited
        trans = self.get_transform()
        # image is created in the canvas coordinate.
        x1, x2, y1, y2 = self.get_extent()
        bbox = mpl.transforms.Bbox(np.array([[x1, y1], [x2, y2]]))
        transformed_bbox = mpl.transforms.TransformedBbox(bbox, trans)
        clip = ((self.get_clip_box() or self.axes.bbox) if self.get_clip_on()
                else self.figure.bbox)
        # Turn off round_to_pixel_border!
        return self._make_image(self._A, bbox, transformed_bbox, clip,
                                magnification, unsampled=unsampled,
                                round_to_pixel_border=False)

fig, ax = plt.subplots(constrained_layout=True)
# Replicate Axes.imshow
ax.set_aspect(mpl.rcParams["image.aspect"])
ai = NotRoundedAxesImage(ax, interpolation="none")
ai.set_data(img)
ai.set_extent(ai.get_extent())
ax.add_image(ai)
ax.scatter(idx[1], idx[0], marker="x", lw=0.2, s=1)
fig.savefig("custom_image.pdf")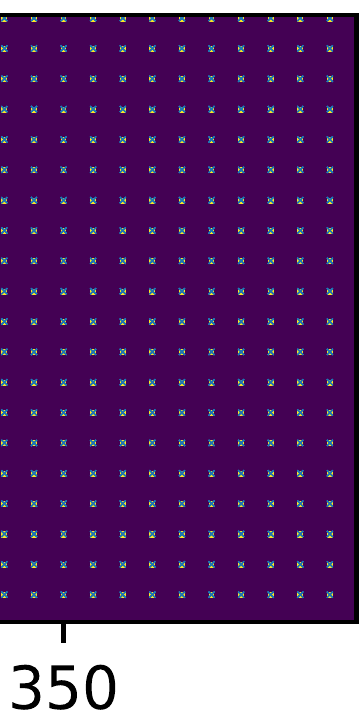
Operating system
Ubuntu 20.04
Matplotlib Version
3.4.3
Matplotlib Backend
PDF, SVG, PGF, probably others
Python version
3.7
Jupyter version
No response
Other libraries
No response
Installation
conda
Conda channel
conda-forge
Metadata
Metadata
Assignees
Labels
No labels