Closed
Description
Bug report
Bug summary
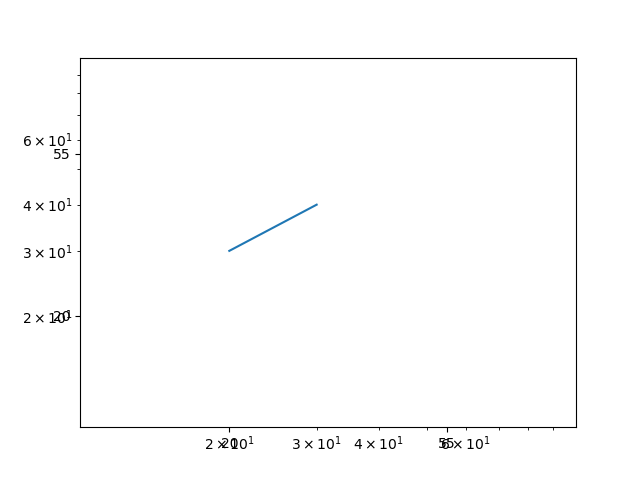
Setting axis ticks in a small log scale produces duplicate tick labels.
Code for reproduction
import matplotlib.pyplot as plt
fig, ax = plt.subplots()
s = 10
ax.axis([s, 100, 10, 100])
ax.loglog([20, 30], [30, 40])
from matplotlib.ticker import ScalarFormatter
for axis in [ax.xaxis, ax.yaxis]:
    axis.set_major_formatter(ScalarFormatter())

ax.set_xticks([20, 55])
ax.set_yticks([20, 55])
plt.show()
Actual outcome
change code a little bit
import matplotlib.pyplot as plt
fig, ax = plt.subplots()
s = 9
ax.axis([s, 100, 10, 100])
ax.loglog([20, 30], [30, 40])
from matplotlib.ticker import ScalarFormatter
for axis in [ax.xaxis, ax.yaxis]:
    axis.set_major_formatter(ScalarFormatter())
ax.set_xticks([20, 55])
ax.set_yticks([20, 55])
plt.show()
Expected outcome

Matplotlib version
- Operating system: Ubuntu 16.04
- Matplotlib version: 2.2.2
- Matplotlib backend: Qt5Agg
- Python version: 3.6
Metadata
Metadata
Assignees
Labels
No labels