CDR Reporting and Call Analytics
Run question-led report templates and CDR ingestion within a minute — self-hosted, free forever. Download the free appliance →
Call Telemetry provides a complete suite of engineering tools to analyze, troubleshoot, and report on Cisco CDR data.
- Cisco Report Examples — Find the right report by question and inspect deterministic CSV, XLSX, and PDF examples. Microsoft Teams reports have their own catalog: Teams Report Examples.
- CDR Reporting — Your daily engineering tool for searching, filtering, and exporting raw call records.
- Call Quality Dashboard — Organization-wide voice quality metrics (MOS, jitter, packet loss) and troubleshooting.
- Call Flow Investigation — Deep-dive troubleshooting to trace complex calls across multiple legs and hunt groups.
- AI Analytics (CT-AI) — Ask questions about your CDRs in plain English and get data-grounded answers with deep links.
Report Categories
Templates are organized into 8 domains:
| Domain | What It Covers |
|---|---|
| Call Completion & Network | Failed calls, cause codes, voice quality (MOS/jitter/packet loss) |
| Cost & Billing | FAC/CMC usage, departmental chargeback, international calls |
| CUBE & SIP Trunk | Gateway capacity, dial-peer performance, trunk utilization |
| Device & Infrastructure | Firmware tracking, dormant devices, call forwarding patterns |
| Hunt Group & Queue | Abandoned calls, agent performance, repeat callers |
| Organizational | Department summaries, manager teams, peak hour analysis |
| Security & Compliance | Toll fraud detection, emergency call tracking, policy blocks |
| User Behavior | Missed calls, dormant users, device adoption (softphone vs hardphone) |
See the generated Cisco Report Examples and Microsoft Teams Report Examples catalogs for the exhaustive, backend-synchronized list.

Licensing and Data Retention
| License Tier | CDR Retention | Report Access |
|---|---|---|
| Free | 7 days (rolling) | Generated template catalog, ad-hoc, view on screen (a license adds exports). Call Flow Investigation and the Call Quality Dashboard show a live count with an upgrade prompt, not the full data. |
| Essentials / Standard / Advanced | Configurable | All templates, exports, Call Flow Investigation, Call Quality Dashboard |
| Premium | Configurable | All templates, saved and scheduled reports |
Configure retention in Settings → Data Retention.
Report Builder
Navigate to Reports → Report Catalog and select a template to open the Report Builder. The Report Builder has four tabs:
| Tab | Purpose |
|---|---|
| Quick Views | Pre-configured queries for common business questions |
| Configuration | Customize dimensions, metrics, filters, and sort order |
| Data | View results table, adjust columns, export |
| Charts | Visualizations generated from your query |

Configuration Options
- Dimensions: Fields to group by (add multiple, drag to reorder)
- Metrics: Calculated values to display (total calls, avg duration, etc.)
- Filters: Limit results by any dimension value
- Metric Filters: Filter on aggregated results (e.g., departments with >100 calls)
- Sort Order: Order results by any dimension or metric

Advanced Filtering
Beyond template dimensions, you can access 125+ raw CDR and CMR fields:
- CDR Fields: Calling/called numbers, device names, partitions, cause codes, timestamps
- CMR Fields: MOS scores, jitter, latency, packet loss, concealment ratio
Click Advanced Filters to open the full field picker with operators like equals, contains, between, and in-list.
Running and Exporting
Click Run Report to execute. Results appear in the Data tab with KPI summaries and a sortable table. Use presets (Last 24h, 7d, 30d) or custom date ranges for the time filter.
Click Export and choose CSV or XLSX to download results.
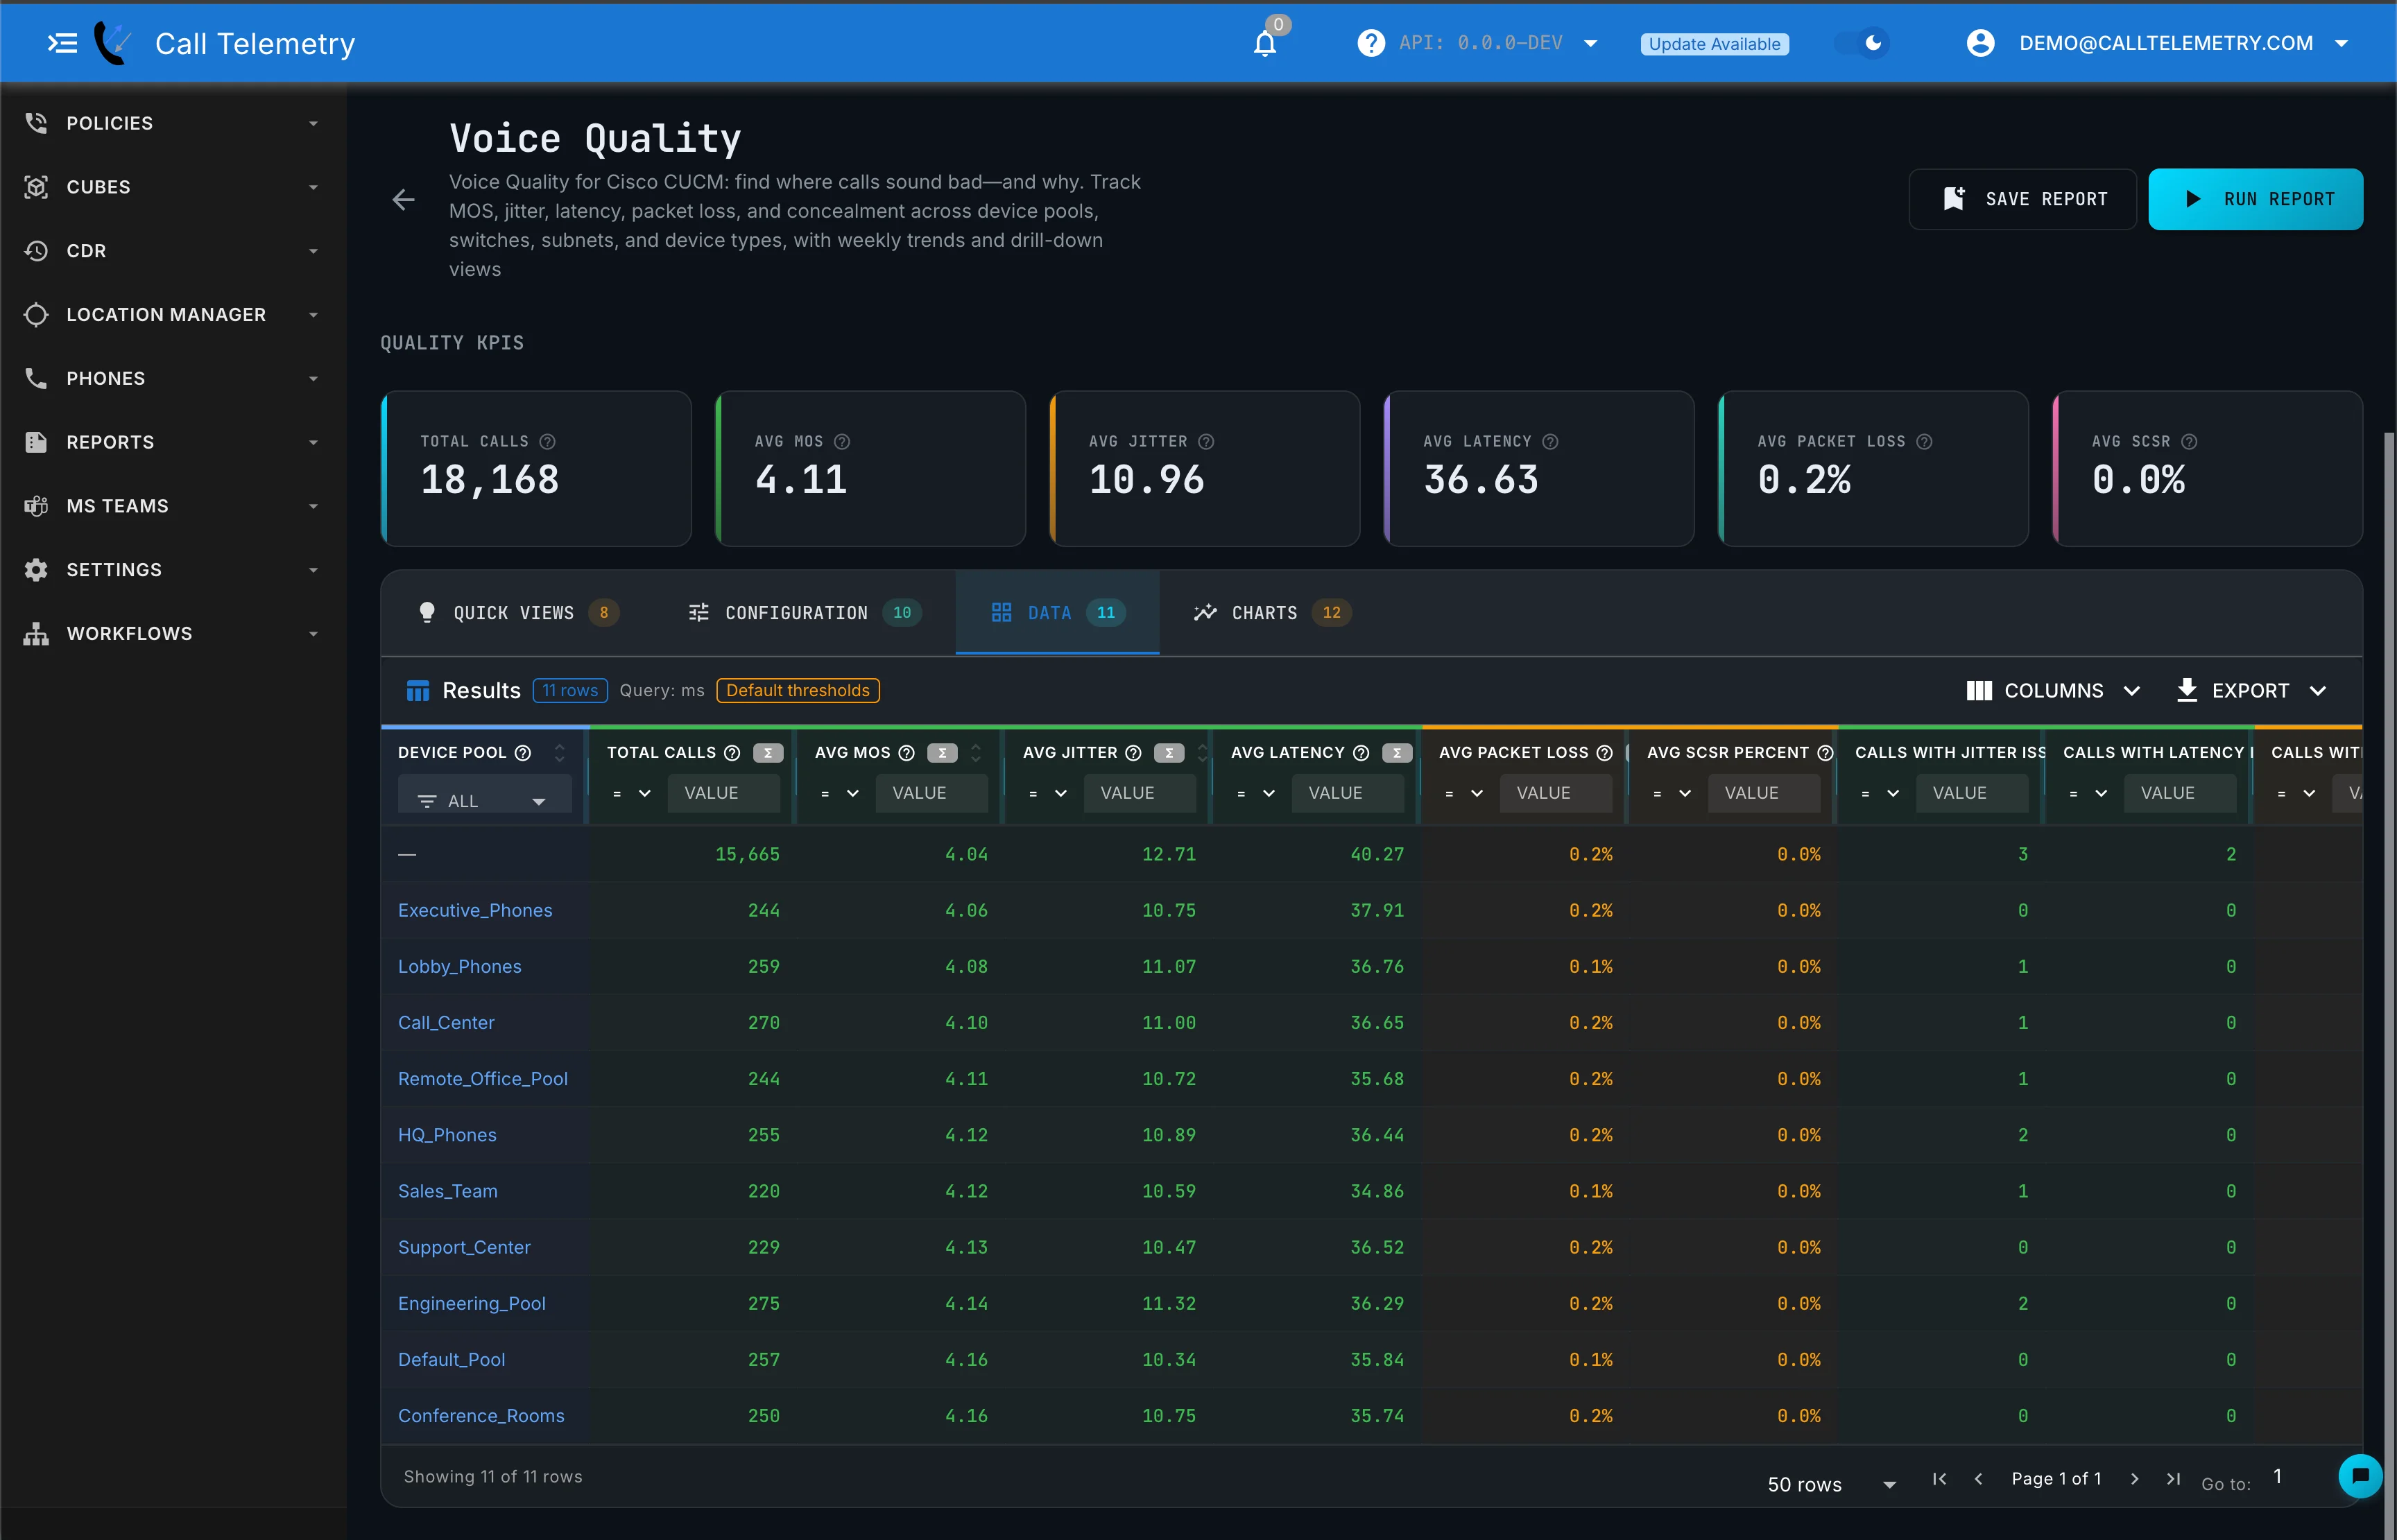
The Charts tab generates visualizations from your query.

Saving and Scheduling Reports
Don't rebuild queries from scratch. Save your configuration for quick re-execution, or schedule automatic delivery.
Saved Reports
- Save any report configuration from the Report Builder
- Access saved reports from Reports → Saved Reports
- Actions: Run, Clone, Edit, Delete
Scheduled Reports
- Deliver reports automatically via email
- Frequency: Daily, Weekly, or Monthly
- Export format: CSV or XLSX
- Add multiple recipients with custom subject/body
See Saved and Scheduled Reports for the complete guide.
Integration with Policy Engine
CDR Reporting connects with Call Telemetry's real-time features:
- Policy Blocking Summary: Analyze calls blocked by the policy engine
- Emergency Call Tracking: E911 calls with location data from discovery apps
- Toll Fraud Detection: Correlate with watch lists and TDoS protection
Historical CDR data gives you the "what happened" to complement real-time policy enforcement.
UC Analytics Dashboard
Put supported aggregate-backed templates and saved reports to work on a live dashboard. The UC Analytics Dashboard provides charts, KPI cards, and real-time refresh so your team can monitor key metrics without rebuilding queries.
Next Steps
- UC Analytics Dashboard — Build custom dashboards from report templates and saved reports
- Report Builder Guide — Detailed walkthrough of all configuration options
- Saved and Scheduled Reports — Automate recurring reports
- Cisco Report Examples — Browse the question-led Cisco catalog and sample exports
- Microsoft Teams Report Examples — Browse the Teams catalog and sample exports
- CDR Reporting — Search, filter, and export raw call detail records
- Call Flow Investigation — Trace individual calls across multiple legs
- CUBE Analytics — Real-time SIP trunk and gateway capacity dashboards
- CDR Setup Guide — Configure Cisco CallManager to send CDR data